UCSC Treehouse Public Data
The Treehouse Childhood Cancer Initiative is a research arm of the UCSC Genomics Institute. We enable the sharing of pediatric cancer genomic data using tools developed by our Genomics Institute colleagues. We use shared data to analyze a child's tumor against both child and adult patient cancer tumors using a "pan cancer" or cross-comparison gene expression analysis. Our goal is to identify situations where an an approved drug, often an adult drug, is predicted to work on a child with cancer.
As part of our research, we have gathered a compendium of RNA gene expression data which we have made available for download and visualization.
Our samples are derived from partner clinical sites and publicly available repositories, including TARGET and TCGA. Expression data from over 12,000 samples is available along with clinical data including age, gender, disease type, and provider site's original ID.
New: Kallisto TPM Gene Expression
June 2023
Kallisto TPM expression matrices are now available for the Tumor Compendium v11 Public PolyA and the Tumor Compendium v9 Public Ribodeplete. These matrices were generated using Kallisto version 0.43.1 and include 12,537 samples (PolyA) and 295 samples (Ribodeplete).
Newest Tumor Compendium: v11
April 2020
The Tumor Compendium v11 Public PolyA is now available for download and visualization. This compendium includes RNA expression data from over 12,000 samples, including 406 newly added samples from the Therapeutically Applicable Research To Generate Effective Treatments (TARGET) program.
Visualizations
TumorMap
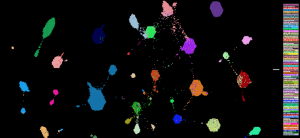
The UCSC TumorMap interactively displays samples in the Treehouse dataset positioned according to their RNA profiles. Users can color the samples based on dataset features like Disease. This browser shows samples clustered using the OpenOrd algorithm and best separates smaller groups. (See "TumorMap: Exploring the Molecular Similarities of Cancer Samples in an Interactive Portal." Cancer Research November 2017).
Cluster Browser
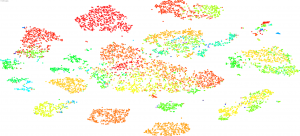
The UCSC Cell Browser interactively displays samples in the Treehouse dataset positioned according to their RNA profiles. Users can color the samples based on dataset features like Disease. This browser quickly shows samples clustered using multiple algorithms such as UMAP and t-SNE, and best shows relationships among larger groups.
Xena
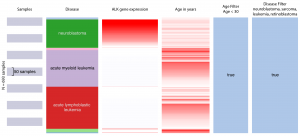
UCSC Xena allows users to explore the Treehouse dataset, finding correlations and trends within and across genomic and phenotypic variables. Users can interactively add, remove, and rearrange arbitrary slices of data including genes, transcripts and other dataset features. This example from our July 2017 dataset shows that neuroblastoma in comparison to other pediatric cancers has a much stronger ALK gene expression and younger patient population.
Files
Three different file types are available.
Selected De-identified Clinical Data
TPM Gene Expression, log2-Normalized
Values in this dataset use HUGO gene names and are TPM (Transcripts Per Million) normalized, transformed by log2(x+1) of the TPM value. These values were originally generated with Ensembl gene IDs. Where multiple Ensembl gene IDs map to a single HUGO name, it was necessary to combine the corresponding values into a single data point. For datasets v4 and v5, this was done by taking the mean of the input values. For datasets v8 and onwards, the input values were instead added together before the logarithm was taken to more accurately reflect the underlying data.