What happens when we perform a genomic analysis of a person’s cancer?
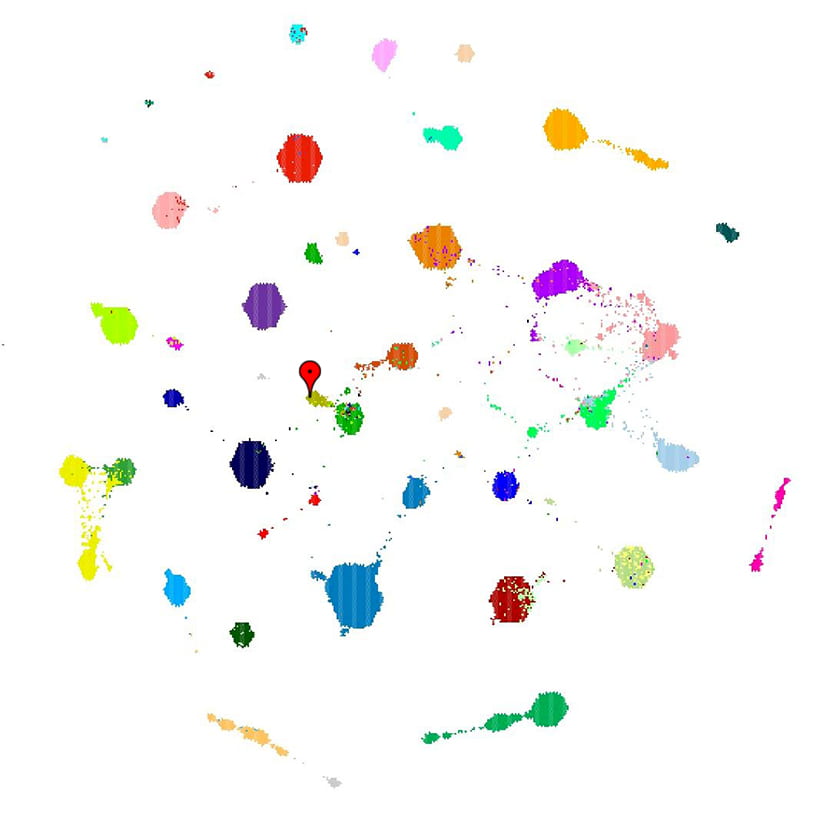
UCSC Analysis: Tumor Map Bird’s eye view (tumors colored by disease)
A tool that plots individual tumors as dots that cluster together, forming a topology of genomic similarity. Researchers can make inferences about a particular tumor based on where it sits on the map.

Tumor Map

The goal is to learn how a tumor differs from the rest of a person on a genomic level and what it has in common with other people’s tumors. Reaching this goal usually starts with a surgeon removing a tumor. A scientist who specializes in preparing tissue for sequencing isolates the DNA and RNA (these two different kinds of molecules are both made up of strings of nucleotides), cuts the nucleotide molecules into shorter pieces, and triggers a series of chemical reactions to prepare the molecules for the sequencer. Next, a technical expert uses a sequencer (which can be the size of a photo booth and cost as much as 10 Tesla Model S cars) to determine the sequences of the short pieces of DNA and generate files containing the sequence of nucleotides represented as A, T, C and G. These steps all require extreme care, because often there isn’t much of the tumor to work with, so a mistake can end the entire process. The sequencing step itself is also very expensive, so even when there is enough to start over with, mistakes are economically costly.
The contents of the file that comes from sequencing the RNA often has more than a billion letters (nucleotides) in it, split into groups of 100-200 letters. If you downloaded the file to your phone, it could take up as much space as a movie. The file that comes from the DNA often has more than 90 billion letters and could barely fit on a large USB thumb drive. These files are next sent to scientists who specialize in analyzing sequence. Using the data from sequencing DNA, we want to find out how the genome sequence of an individual tumor compares to the sequences from thousands of other tumors.

Analysis of Patient TH_005

in the context of thousands of tumors


Bird’s eye view (tumors colored by disease)

Zoom in on the glioma region (tumors now colored by grade)
Zoom in on the glioma region (tumors now colored by gliona subtype)

“ The DNA and RNA tell us different things (changes to letters on the one hand, and how often genes are activated on the other), but the first step in getting answers from files is the same: Take each set of 100-200 letters and find the most likely source position among the 3.2 billion letters in the human genome reference. This is not unlike taking your copy of the complete works of Shakespeare (your genome), shredding it (sequencing it), and trying to match the shreds up to the library’s copy of the book (the human reference genome). Most parts are the same, but often there are small or large differences between the shreds and the library’s book, similar to what you’d find if it was a different edition.”

This step, matching the shreds to the expected sequence for a human, is called mapping. This step and the next ones are performed by bioinformaticians. Generally, bioinformaticians are people who specialize in handling biological information. In this case, they specialize in interpreting data generated by the parallel processes of genomic sequencing and rely heavily on computers.
By analyzing a single tumor, we can find out how that tumor’s genomic information compares to thousands of tumors.

Unlike one person comparing shreds of their book to the library’s copy,

The first step is to look over all the shreds that were matched to the library book and see where they differ. Sometimes it’s a one nucleotide change, the equivalent of a spelling difference. A change in spelling may change the meaning (bit vs bat) or not (color vs colour). Similarly, changes to DNA can have a major effect, a minor effect, or no observable effect. The changes can be on a bigger scale, like missing or added words, or missing or duplicated chapters. Even among those larger scale changes, some have large effects and others don’t. The bioinformatician makes a list of the changes predicted to be important and indicates which ones have a known meaning or (better) are known to respond to a certain treatment. A cancer biologist then considers this information in the context of everything they know about various kinds of cancer.

By analyzing a single tumor, we can find out how that tumor’s genomic information compares to thousands of tumors.

Unlike one person comparing shreds of their book to the library’s copy,

…this analysis is more similar to a group of people who each photocopy their favorite parts of Shakespeare’s collected works from the library. If they all put the photocopied pages in the same shredder after they read them, after we matched the shreds back to the original book, we could tell which plays or sonnets were most popular. The equivalent biological information can tell us what genes are activated in a cancer, and we can compare that to data from other individuals with cancer. The combination of levels of gene activation gives us a profile, and can help us see whether a cancer is similar to what is expected, or is different on a molecular level. Again, bioinformaticians and cancer biologists work together to identify any ramifications this comparison might have on treating the person’s cancer.
Employing computational analysis of genomic data can help identify targeted treatments that are less toxic and more effective than the state-of-the-art therapies.